Gold & Silver
Physical Silver Bullion: The Gold-Silver Ratio and Industrial Demand
By NorwegianSpark Editorial — written with AI assistance and reviewed by the NorwegianSpark SA editorial team | Last updated: 2026-10-05
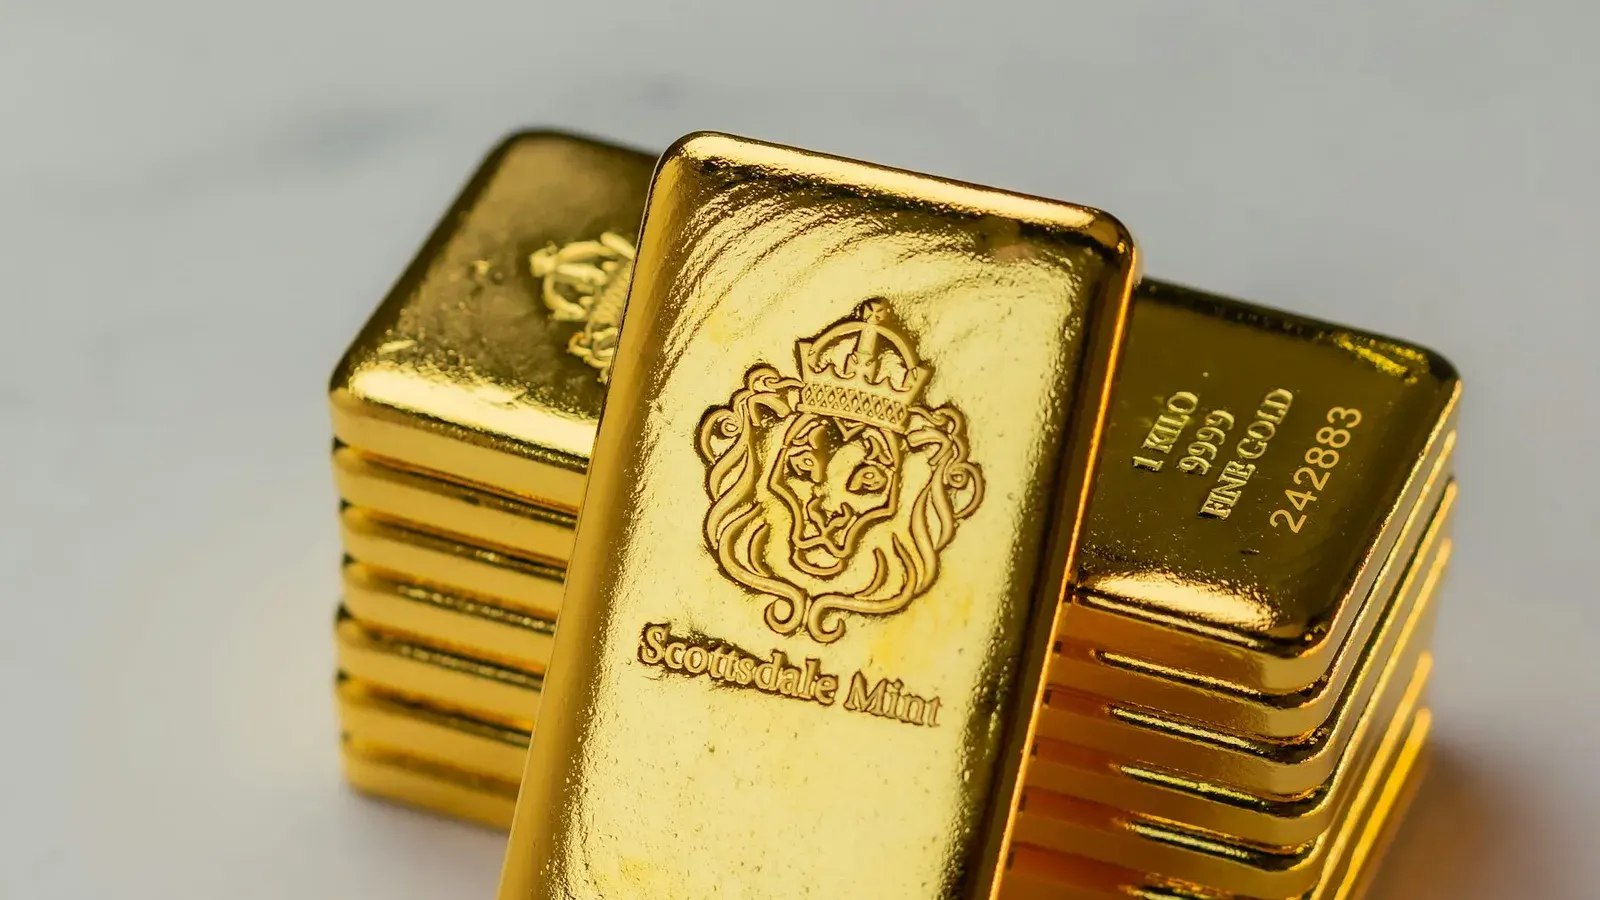
The Monetary Dichotomy: Precious Metal Store of Value vs. Essential Industrial Element
Why silver matters to industry as well as to investors
Silver occupies a unique dual status in the global commodities market: it is both a historic monetary reserve asset recognized for 5,000 years of civilization and an irreplaceable industrial element critical to modern high-technology manufacturing. The Royal Society of Chemistry describes silver as the best reflector of visible light known, and electronics use it where copper cannot quite deliver the conduction needed.
While central banks hoard gold bars as sovereign tier-one capital reserves, private industry continuously consumes physical silver in microelectronics, medical biocides, aerospace satellite arrays, and advanced green energy generation.
The Silver Institute reported that demand exceeded supply in 2023 for the third consecutive year, a deficit of 184.3 million ounces. Whether that tightens the bullion available to investors, and what it does to the price, is a forecast rather than a certainty.
Physical Element Fact — Silver is element 47 on the periodic table. It has the lowest electrical resistance of all metals at standard temperatures, and the Silver Institute says potential substitute metals cannot match silver in energy output per solar panel.
The Gold-to-Silver Ratio (GSR): Historical Mean Reversion
Analyzing 2,000 years of monetary ratios from Ancient Rome to the present day
The Gold-to-Silver Ratio (GSR) measures how many ounces of physical silver are required to purchase a single ounce of physical gold. In Ancient Rome, the legal ratio was set at 12:1. The US Coinage Act of 1792 set the ratio at 15:1. In the Earth’s geological continental crust, silver is approximately 19 times more abundant than gold.
In modern markets the ratio has swung widely and has spent long periods far above those historical legal ratios. Some investors swap between gold and silver when they think the ratio is stretched, but there is no guarantee it will revert to any particular level.
If the ratio halved while the gold price stayed the same, the silver price would double — but the ratio can equally widen, and nothing guarantees either move. Capital at risk: gold and other metals can fall in price as well as rise, and nothing here is financial advice.
| Historical Era / Benchmark | Gold-to-Silver Ratio (GSR) | Economic & Monetary Driver |
|---|---|---|
| Ancient Roman Empire (Julius Caesar) | 12.0 : 1 | Bimetallic currency circulation standard |
| US Coinage Act of 1792 | 15.0 : 1 | Constitutional silver/gold bimetallic dollar standard |
| January 1980, monthly average | 17.4 : 1 | Lowest monthly ratio in the World Bank series since 1971; gold $675.31, silver $38.876 per troy oz |
| April 2011, monthly average | 34.7 : 1 | Lowest monthly ratio of 2011; gold $1,480.89, silver $42.695 per troy oz |
| April 2020, monthly average | 111.7 : 1 | Highest monthly ratio in the World Bank series, 1960 to 2024; gold $1,683.17, silver $15.065 per troy oz |
| December 2024, monthly average | 86.1 : 1 | Latest month in the World Bank file used here; gold $2,648.01, silver $30.764 per troy oz |
| Modern markets | Wide swings; check the current ratio | No guaranteed reversion to any level |
The four dated rows are calculated from the World Bank's Commodity Price Data (the Pink Sheet): monthly averages of the London afternoon fixing for gold (99.5% fine) and silver (99.9% refined), in US dollars per troy ounce, from the edition updated on 3 January 2025. Each ratio is the gold price divided by the silver price for that month. Daily highs and lows went further than any monthly average, so treat these as the shape of the range, not its extremes.
Explore secure non-bank vault custody for large silver holdings to avoid home storage weight constraints. Start with secure vault storage solutions for high-volume silver bullion stacks.
Solar Photovoltaic & Industrial Demand
How next-generation TOPCon solar panels are depleting annual silver mine supply
The global transition toward solar photovoltaic (PV) renewable electricity is reshaping the silver supply-demand balance. The Silver Institute attributes part of the recent growth in silver demand to higher-than-expected photovoltaic capacity additions and faster adoption of new-generation solar cells such as N-type TOPCon and heterojunction designs.
The Silver Institute's World Silver Survey 2024 put photovoltaic demand at a record 193.5 million ounces in 2023, against global mine production of 830.5 million ounces — roughly 23% of mine output.
Because a large share of silver is mined as a by-product of copper, lead, zinc and gold mining, output responds slowly to the silver price itself.
Bulk Silver Stacking Strategy — Silver Gold Bull sells silver bars in a range of sizes with delivery or allocated vault storage; see the current range and prices on the dealer's site.
Optimal Physical Formats: 1 oz Coins vs. 10 oz & 100 oz Bars
Minimizing minting fabrication premiums to maximize total ounce accumulation
Because silver trades at a lower dollar price per ounce than gold, fabrication and shipping costs represent a higher percentage of the total purchase price on smaller units. A 1 oz Silver American Eagle or Maple Leaf coin typically carries a noticeably higher percentage premium than a large bar; see the current price on the dealer's site.
To maximize total weight acquired, serious investors focus on larger-format bullion bars:
10 oz Silver Bars: A balance between lower premiums and manageable, divisible resale units.
1 Kilogram (32.15 oz) Silver Bars: Widely favored in Europe and Asia for precise metric accounting and compact storage density.
100 oz Silver Bars: Usually the lowest premium per ounce of the three, for larger allocations.
Compare industrial precious metals like silver and platinum with monetary gold. Start with platinum and gold compared.
Gold and collectibles carry risk and prices fluctuate — nothing here is financial advice. Consider your own situation or speak to a qualified adviser.
Related Collections
Frequently Asked Questions
Is physical silver taxable when purchased?
It depends where you buy. In the United States, many states exempt bullion from sales tax, but the rules vary by state and sometimes by purchase size. In Canada, silver bars, ingots, coins or wafers refined to at least 99.9% are 'precious metal' for GST/HST purposes and their supply is generally exempt. In the UK and EU, VAT generally applies to silver unless it is bought and held within a bonded warehouse. Check the current rules where you live.
How do I prevent silver bullion bars from tarnishing?
Silver naturally tarnishes when exposed to airborne sulfur compounds, forming a thin layer of silver sulfide. Tarnish does not reduce the pure silver content or bullion melt value. Store silver in airtight polyethylene tubes, sealed monster boxes, or with desiccants in a dry environment.
Why are premiums higher on silver than on gold?
Silver is worth far less per ounce than gold, so the same sum of money buys many more ounces — at a gold-silver ratio of 80:1, about 80 ounces of silver for every ounce of gold. Minting, packaging and transporting that much more metal costs more per unit of value, which shows up as a higher percentage premium.
What is the best way to liquidate a 100 oz silver bar?
Online dealers such as Silver Gold Bull quote buyback prices based on live spot pricing; check the current buyback price and shipping arrangements before you send the bar. If the bar is already held in the dealer's vault storage, you can sell it from storage without handling the metal.
Continue Reading
gold silver
Fractional Gold Bullion Bars & Coins: 1g to 20g Buying Strategy & Premium Analysis
A strategic financial breakdown of fractional gold bullion ownership.
gold silver
Tax-Free Gold Bullion: Legal Tender Exemptions, CGT, & IRA Rules
A comprehensive jurisdictional tax guide for physical precious metals investors.
gold silver
Platinum vs Gold: Price History, Supply Risk and Demand
A deep-dive investigation into the metallurgical scarcity and price dynamics between physical platinum (.9995 fine) and gold (.9999 fine).